Decoding Social Intent
from Neural Oscillations

Spectral analysis of calcium imaging reveals a theta-enriched neuron subpopulation that encodes social behavior

Kaiwen Bian1 · Ketan Mittal1 · Anirudh Annabathula1 · Yixuan Xin2

1Halıcıoğlu Data Science Institute   2Department of Cognitive Science
University of California, San Diego

GitHub EDGE Data

Social behavior requires coordinated neural activity, yet whether spectral signatures of individual neurons can predict social state remains unclear. We analyzed calcium imaging recordings from mouse prefrontal cortex across 18 sessions, extracting frequency-band power features from 3,938 neurons. While theta-band (4–7 Hz) power increases during social interaction at the population level (Cohen's d = 0.235, p < 0.001), classification using all neurons fails a permutation test. Spectral clustering reveals two subpopulations: a majority (70%) dominated by infraslow oscillations, and a minority (30%) enriched in delta and theta power. Only this minority subpopulation significantly classifies social vs. solo behavior (AUC = 0.570, permutation p = 0.020), using theta/delta ratio—not raw power—as its top feature. These results suggest that social coding is concentrated in a spectrally distinct neuronal minority.

The Question

Theta-band (4–7 Hz) oscillations in the prefrontal cortex track social behavior in mice. Kuga et al. (2022) showed this with electrophysiology and confirmed it causally via optogenetics, while Mohapatra et al. (2025) demonstrated that excess theta synchrony impairs social discrimination. But these findings come from local field potentials—a macroscopic signal. We asked: can the same theta signatures be recovered from individual neurons using calcium imaging?

Calcium imaging studies of social behavior in mPFC have revealed rich single-cell coding (Liang et al. 2018; Kingsbury et al. 2019; Frost, Haggart & Sohal 2021), but every study uses rate-based or correlation-based measures—none have examined frequency content. The technical challenge is real: GCaMP6s has a ~600 ms decay time, placing theta at the very edge of what calcium imaging can resolve. Still, spectral analysis of calcium traces has been validated in other contexts (Tibau et al. 2013; Zhu et al. 2018), just never for social behavior.

We bridge this gap using data from the EDGE neuroscience course (Talmo Pereira and colleagues), applying spectral feature extraction—Welch PSD, band power, theta/delta ratio—to single-neuron calcium traces. Rather than asking which neurons fire more, we ask which neurons oscillate differently.

Three Questions

Our analysis follows three questions, each building on the last:

  1. Band–Behavior Link — Do specific frequency bands of the calcium signal differentiate social from solo epochs?
  2. Neuron–Band Heterogeneity — Do neurons split into subpopulations with distinct spectral profiles?
  3. Subpopulation Classification — Does a spectrally defined subpopulation drive behavior classification?

From Video to Behavior Labels

A resident mouse is recorded alone in an arena, then joined by an intruder. Video is captured at 25 fps and processed through SLEAP, a deep-learning pose tracker that identifies 15 body keypoints on each animal. We define "social" as frames where the resident's nose is within 10 pixels of the intruder's nearest body part.

Figure 1. SLEAP pose tracking and social proximity analysis. (A) Behavior video with skeleton overlays (green = resident, orange = intruder). (B) Nose-to-body distance with 10-pixel social threshold; the red bar indicates social contact periods. 30-second clip from Session 5 (Animal 5-2, 24hr isolation).

Side-by-side comparison of NOT SOCIAL vs SOCIAL frames with distance annotations

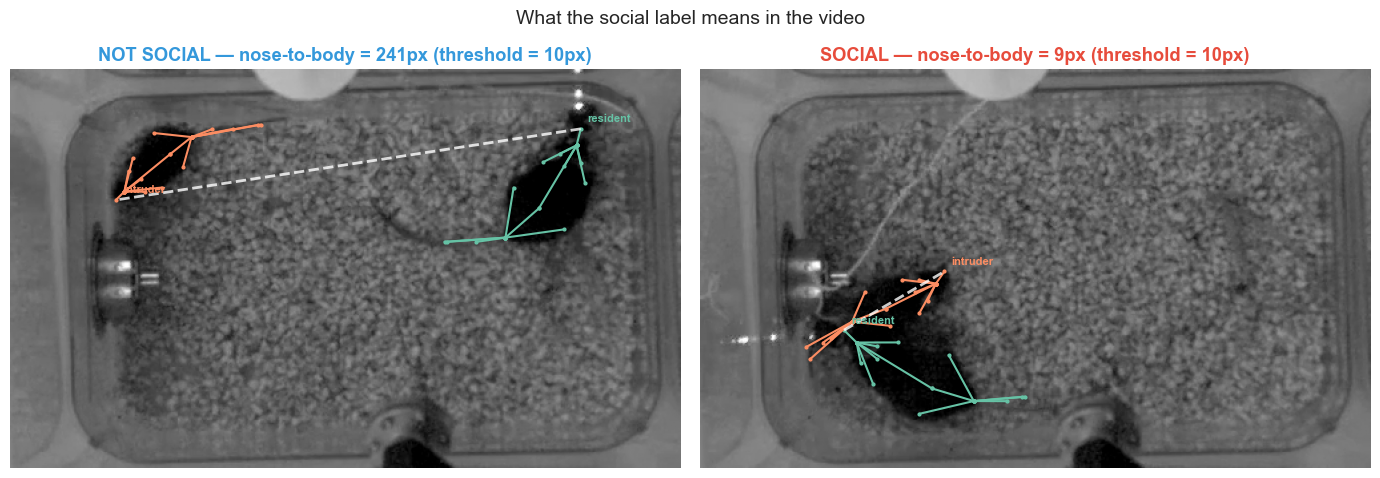
Figure 2. What "social" means in practice. Left: animals separated (distance > 80 px, blue border). Right: nose-to-body contact (distance < 10 px, red border). The dashed white line shows the measured distance between resident nose and intruder body.

These binary labels are resampled from 25 fps to 30 fps to match the calcium imaging frame rate, giving us a behavior timeseries aligned with every neural data point.

The Neural Recording

While the mouse behaves, a miniature microscope images calcium fluorescence through a GRIN lens implanted in the prefrontal cortex. Neurons that fire produce transient increases in fluorescence (ΔF/F), giving us a continuous signal for each cell at 30 fps.

Correlation image showing the circular field of view with neuronal structures

Figure 3. Correlation image (Cn) of the imaging field of view. Brighter regions indicate spatially correlated activity, corresponding to neuronal cell bodies. The circular boundary reflects the GRIN lens aperture.

Calcium traces of top active neurons with social epoch shading

Figure 4. Raw calcium traces from the most active neurons in one session. Red-shaded regions indicate social epochs. Each row is a different neuron; the y-axis shows z-scored fluorescence (ΔF/F).

3,938 Total Neurons
18 Recording Sessions
~87 min Total Recording Time
30 Hz Sampling Rate

How Neurons Respond to Social Contact

Before asking classification questions, we characterized how individual neurons' spectral content relates to behavior. Using Butterworth bandpass filters, we decomposed each neuron's calcium trace into four frequency bands: infraslow (0.01–0.1 Hz), slow (0.1–1 Hz), delta (1–4 Hz), and theta (4–7 Hz).

Band-filtered signal decomposition showing infraslow, slow, delta, and theta components aligned with social epochs

Figure 5. Spectral decomposition of a single neuron's calcium trace. Each row shows a different frequency band with its Hilbert envelope. Red shading marks social epochs. Note the visible modulation of delta and theta envelopes during social periods.

To quantify each neuron's social sensitivity, we computed a Social Modulation Index (SMI): the normalized difference in mean activity between social and solo epochs. An SMI of +1 means exclusively active during social contact; −1 means exclusively suppressed.

Social Modulation Index distribution and heatmaps of top excited and suppressed neurons

Figure 6. Social modulation across the neural population. Left: distribution of SMI values — 87% of neurons show significant modulation (|SMI| > threshold), but responses are heterogeneous. Right: heatmaps of the most socially excited (top) and suppressed (bottom) neurons, aligned to social bout onset.

Key insight: Most neurons respond to social state, but in opposite directions — some increase activity, others decrease. This heterogeneity means a simple population average would cancel out the signal.

Theta Power Dominates Social Encoding

We computed Welch PSD estimates for every neuron in every 1-second epoch, then compared band power between social and solo windows. Effect sizes (Cohen's d) quantify how much each band's power differs between conditions.

Bar chart comparing band power between social and solo conditions, with Cohen's d effect sizes

Figure 7. Left: mean band power (log scale) during social vs. solo epochs across all neurons and sessions. Right: Cohen's d effect sizes with 95% bootstrap confidence intervals. Theta shows the largest effect (d = 0.235), followed by delta (d = 0.069). Both delta and theta pass Bonferroni correction (p < 0.001); infraslow and slow do not.

Theta-band power is systematically higher during social interaction (d = 0.235, p = 6.5×10⁻¹⁷), consistent across 14 of 18 sessions. This aligns with electrophysiology findings (Kuga et al. 2022), confirming theta signatures are recoverable from calcium imaging despite its limited bandwidth.

Two Distinct Spectral Populations

Not all neurons contribute equally to the theta signal. K-means clustering (k = 2) on each neuron's fractional band power spectrum — the proportion of total power in each frequency band — reveals two distinct spectral types.

Cluster centroid profiles, all-neuron spectral heatmap, and per-session cluster proportions

Figure 8. Left: cluster centroid profiles showing fractional band power. Cluster 0 (70% of neurons) is dominated by infraslow/slow power. Cluster 1 (30%) has 3× more delta and theta power. Center: all-neuron heatmap sorted by cluster. Right: cluster proportions are stable across all 18 sessions and isolation conditions.

Neurons split into a slow-dominated majority (70%) and a delta+theta enriched minority (30%). This partition is robust across animals and isolation conditions, suggesting it reflects an intrinsic property of the neural population rather than a recording artifact.

Only the Minority Predicts Behavior

We trained linear classifiers (LDA, SVM, Logistic Regression) on spectral features extracted from each cluster separately, using GroupKFold cross-validation by session. Classification performance was validated against a permutation test baseline (100 shuffles).

AUC comparison between all neurons, Cluster 0, and Cluster 1, plus feature importance rankings

Figure 9. Left: AUC scores for classifiers trained on all neurons, Cluster 0 only, and Cluster 1 only. Dashed lines show permutation-test chance levels. Right: top features by importance — Cluster 1 uses theta/delta ratio (spectral shape), while the full population relies on raw theta power.

0.535 All Neurons AUC
(p = 0.196, n.s.)
0.519 Cluster 0 AUC
(p = 0.407, n.s.)
0.570 Cluster 1 AUC
(p = 0.020 *)
Only Cluster 1 — the 30% theta-enriched minority — significantly classifies social vs. solo behavior (AUC = 0.570, permutation p = 0.020). Using all neurons together fails the permutation test (p = 0.196), because the slow-dominated majority dilutes the signal. The discriminative strategy also differs: Cluster 1 relies on theta/delta ratio (spectral shape), not raw theta power.

Where Are These Neurons?

If Cluster 1 neurons are functionally distinct, are they also spatially grouped? We mapped each neuron's centroid position onto the correlation image and color-coded by cluster membership.

Neuron centroids scattered on correlation image, color-coded by spectral cluster

Figure 10. Neuron centroid positions overlaid on the correlation image, colored by cluster membership. Cluster 0 (blue) and Cluster 1 (red) neurons are spatially intermixed throughout the field of view, with no apparent clustering by location.

Activity rasters for each cluster with social epoch overlay

Figure 11. Activity rasters separated by cluster, with social epochs shaded in red. Each row is a neuron; color intensity represents z-scored calcium activity. Cluster 1 neurons show more visible modulation aligned with social transitions.

Weighted intensity maps showing spatial distribution of delta and theta power

Figure 12. Delta and theta weighted intensity maps. Each neuron's spatial footprint is weighted by its band power. Despite Cluster 1's stronger theta content, both clusters contribute to the spatial distribution — confirming that spectral identity is neuron-intrinsic, not location-dependent.

Key finding: Cluster 1 neurons are spatially dispersed and intermixed with Cluster 0, not localized to a specific subregion. Their spectral identity appears to be an intrinsic cellular property rather than a consequence of spatial position within the imaging field.

A Spectral Minority Encodes Social State

Our three-question analysis reveals a consistent narrative: theta-band power increases during social interaction, but this signal is not uniformly distributed across neurons. A minority subpopulation (30%) with enriched delta and theta power is both necessary and sufficient for above-chance behavioral classification, while the slow-dominated majority contributes noise that degrades performance.

This result carries a methodological implication: population-level analyses that average across all neurons may miss signals concentrated in spectrally defined subpopulations. The standard approach of computing mean population PSD would have led us to conclude that classification fails — only by first identifying the relevant subpopulation did the signal emerge.

Limitations

Calcium imaging imposes a hard bandwidth limit — we cannot resolve gamma oscillations (>30 Hz) that electrophysiology studies implicate in social coding. Our recordings span a single cortical region (prefrontal cortex) imaged through a GRIN lens, capturing a 2D projection of a 3D structure. The modest classification AUC (0.570) reflects both genuine biological noise and the inherent limitations of calcium imaging as a proxy for neural activity.

Future Directions

Simultaneous electrophysiology and calcium imaging could test whether Cluster 1 neurons correspond to a known electrophysiological cell type. Multi-region imaging (e.g., prefrontal + amygdala) could reveal whether the theta-enriched subpopulation participates in inter-area synchrony during social behavior. Finally, causal experiments — optogenetic silencing of spectrally identified neurons — would test whether the subpopulation is necessary for social behavior, not just predictive of it.

References

  1. Kuga N, Abe R, Takano K, Ikegaya Y, Sasaki T (2022). Prefrontal-amygdalar oscillations related to social behavior in mice. eLife, 11, e78428.
  2. Liang B, Zhang L, Barbera G, et al. (2018). Distinct and dynamic ON and OFF neural ensembles in the prefrontal cortex code social exploration. Neuron, 100(3), 700–714.e9.
  3. Frost NA, Haggart A, Sohal VS (2021). Dynamic patterns of correlated activity in the prefrontal cortex encode information about social behavior. PLOS Biology, 19(5), e3001235.
  4. Kingsbury L, Huang S, Wang J, et al. (2019). Correlated neural activity and encoding of behavior across brains of socially interacting animals. Cell, 178(2), 429–446.e16.
  5. Mohapatra AN, Jabarin R, Ray N, Netser S, Wagner S (2025). Impaired emotion recognition in Cntnap2-deficient mice is associated with hyper-synchronous prefrontal cortex neuronal activity. Molecular Psychiatry, 30, 1440–1452.
  6. Tibau E, Valencia M, Soriano J (2013). Identification of neuronal network properties from the spectral analysis of calcium imaging signals in neuronal cultures. Frontiers in Neural Circuits, 7, 199.
  7. Zhu L, Lee CR, Margolis DJ, Najafizadeh L (2018). Decoding cortical brain states from widefield calcium imaging data using visibility graph. Biomedical Optics Express, 9(7), 3017–3036.
  8. Pereira TD, et al. EDGE: Education in Data and Guided Exploration. Salk Institute / UC San Diego. Calcium imaging and behavioral tracking datasets used in this project.